Understanding Metrics Dimensions and Measures
Data is everywhere in modern business. Companies use data to understand customers, improve products, and make better decisions. However, raw numbers alone do not provide meaningful insights. Analysts need a structured way to organize and interpret information. This is where metrics, dimensions, and measures become important in data analytics.
Understanding these concepts helps beginners build stronger analytical skills. They also make reports and dashboards easier to understand. If you want practical industry knowledge and hands-on learning, you can explore Data Analytics Courses in Bangalore at FITA Academy to strengthen your career path in analytics.
What are Metrics in Data Analytics
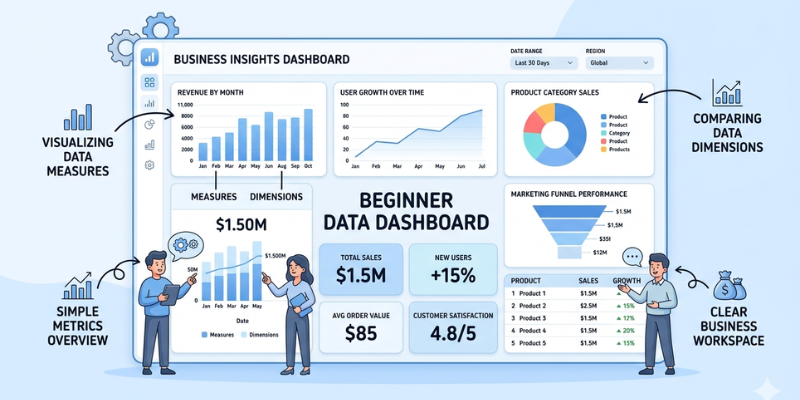
Metrics are quantifiable indicators that assist companies in monitoring their performance. They show whether a company is achieving its goals or falling behind. Metrics are usually tied to important business objectives such as revenue, customer growth, or product performance.
For example, a business may track monthly sales, website traffic, or customer retention rates. These numbers help decision-makers understand current performance and identify areas that need improvement. Metrics are often displayed in reports and dashboards because they provide a quick summary of business health.
Good metrics should be clear, measurable, and relevant to business goals. A confusing or unnecessary metric can lead to poor decisions. Analysts must choose metrics carefully to ensure they reflect meaningful business outcomes.
Understanding Dimensions in Analytics
Dimensions are descriptive categories that provide context to data. They help users organize and filter information for deeper analysis. Unlike metrics, dimensions are usually not numerical values. Instead, they describe attributes related to the data.
Common examples of dimensions include product category, customer location, sales region, and date. For instance, if total sales are the metric, then region or product type can act as dimensions to break down the results further.
Dimensions make reports more useful because they help analysts compare data from different perspectives. A company may want to know which city generated the highest sales or which age group purchased the most products. Without dimensions, such comparisons would be difficult to make.
What are Measures in Data Analytics
Quantitative values that can be computed or examined are referred to as measures. They are often confused with metrics because both involve numbers. However, measures are raw quantitative data, while metrics are usually calculated values tied to business objectives.
Examples of measures include sales amount, number of customers, profit, and quantity sold. These values can be summed, averaged, or compared during analysis. Measures often work together with dimensions to create meaningful reports.
For example, a sales dashboard may show total revenue as a measure while using region and month as dimensions. This combination allows businesses to understand where and when revenue is growing. If you want to improve your practical understanding of these concepts and apply them in real projects, you can consider joining a Data Analytics Course in Hyderabad to build strong analytical expertise for future opportunities.
Difference Between Metrics, Dimensions, and Measures
Although these terms are closely related, they serve different purposes in analytics.
Metrics focus on business performance and goal tracking. Measures represent raw numerical values used during calculations. Dimensions provide descriptive details that organize and categorize the data.
For example, imagine an online store analyzing sales performance. The total revenue generated is a measure. The customer location and purchase date are dimensions. The conversion rate or monthly growth percentage becomes a metric because it reflects business performance.
Understanding these differences helps analysts create clearer reports and avoid confusion during data interpretation.
Why These Concepts Matter in Business
Businesses depend on analytics to guide their decision-making processes. Metrics, dimensions, and measures create the foundation for effective reporting and visualization. Without them, data can become disorganized and difficult to interpret.
These concepts also improve communication between teams. Managers, analysts, and executives can understand reports more easily when data is properly structured. This leads to faster decision-making and better business strategies.
For beginners, mastering these basics is an important step toward learning advanced analytics tools and techniques. Strong knowledge of these concepts can also improve career opportunities in data-driven industries.
Metrics, dimensions, and measures are essential building blocks in data analytics. Metrics help track business goals, measures represent numerical values, and dimensions provide context for deeper insights. Together, they help businesses transform raw data into meaningful information.
Learning these concepts early can make data analysis easier and more effective. They also prepare beginners for advanced reporting, visualization, and business intelligence tasks. If you are planning to develop professional analytics skills and gain practical exposure, you can take a Data Analytics Course in Ahmedabad to enhance your knowledge and increase your confidence in handling actual business data.
Also check: Confidence Intervals Made Easy for Beginners