Bollinger Band Formula & Trading Strategy Guide
Bollinger Band Formula Explained: A Complete Guide for Beginners | Trendy Traders
Introduction
Have you ever looked at a stock chart and wondered how traders know when prices are too high or too low? That’s where the Bollinger Bands indicator comes into play. It is one of the simplest yet most powerful tools used in trading.
In this guide, we will break down what is Bollinger Band, how the Bollinger band formula works, and how traders use it in real markets. Don’t worry—we will keep everything simple, clear, and beginner-friendly.
Think of Bollinger Bands like rubber bands around price movement. When prices stretch too far, they often snap back. Sounds interesting, right? Let’s dive in.
Learn bollinger bands indicator, bollinger bands trading strategy, what is bollinger band, bollinger band formula, best trading trainer in india in this easy guide.
What is Bollinger Band?
The Bollinger Band is a technical analysis tool used in trading to measure market volatility. It helps traders understand whether a stock price is high, low, or within a normal range.
In simple words, it shows:
-
When prices are “too high”
-
When prices are “too low”
-
When the market is calm or volatile
Imagine a river. When water flows normally, it stays within its banks. But when there is heavy rain, the river expands. Similarly, price movements expand and contract within Bollinger Bands.
History of Bollinger Bands
The Bollinger Bands were created by John Bollinger in the 1980s. His goal was to design a tool that adapts to changing market conditions.
Before this, traders used fixed percentage bands, which didn’t adjust well to volatility. Bollinger solved this problem by using standard deviation, making the indicator more dynamic and reliable.
Bollinger Band Formula Explained
Now let’s talk about the most important part—the Bollinger band formula.
The formula consists of three parts:
Middle Band
This is a simple moving average (SMA):
Middle Band = 20-day SMA
Upper Band
Upper Band = SMA + (2 × Standard Deviation)
Lower Band
Lower Band = SMA − (2 × Standard Deviation)
Key Idea
-
SMA shows average price
-
Standard deviation measures volatility
-
Bands expand and contract based on market movement
So, when volatility increases, bands widen. When volatility decreases, bands tighten.
Components of Bollinger Bands
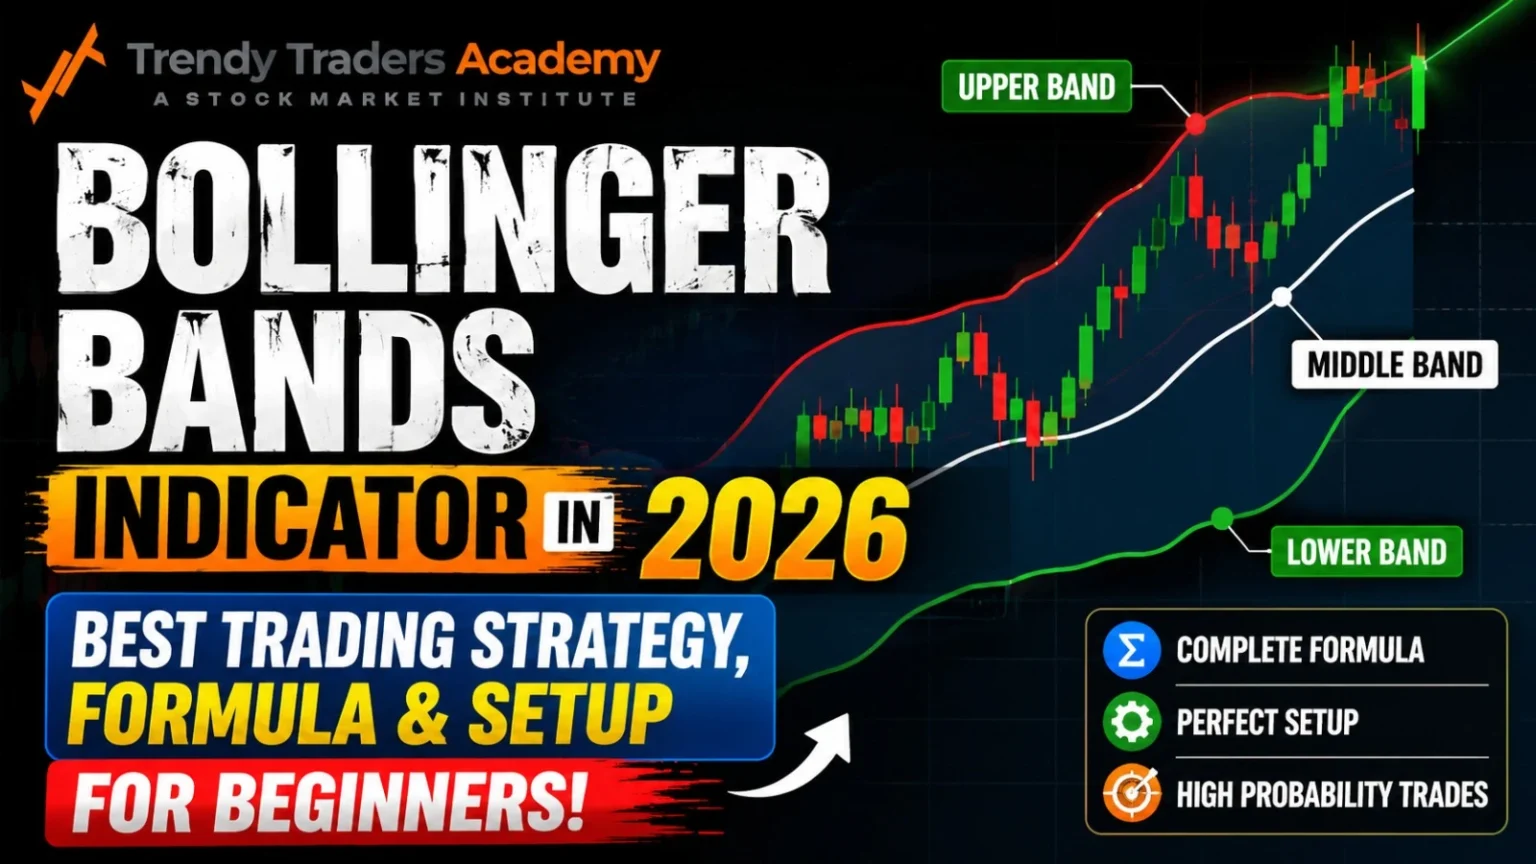
The Bollinger Bands indicator has three key components:
1. Middle Band
This is the trend line. It shows the average price over a specific time period.
2. Upper Band
It represents overbought conditions. When price touches this band, it may be too high.
3. Lower Band
It represents oversold conditions. When price hits this band, it may be too low.
Together, they create a price channel that traders use for decision-making.
How Bollinger Bands Work
Bollinger Bands work by tracking volatility.
-
When market is calm → Bands contract
-
When market is active → Bands expand
This helps traders identify potential breakout or reversal points.
Think of it like a spring:
-
The more it compresses, the stronger the release.
Understanding the Bollinger Bands Indicator
The Bollinger bands indicator is widely used in stock trading, forex, and crypto markets.
It helps traders:
-
Identify trend direction
-
Spot reversal points
-
Measure volatility
-
Find entry and exit points
But remember, no indicator is perfect. It works best when combined with other tools.
Basic Bollinger Bands Trading Strategy
A simple Bollinger bands trading strategy involves:
Buy Signal
-
Price touches or goes below lower band
-
Then starts moving upward
Sell Signal
-
Price touches or goes above upper band
-
Then starts falling
However, blindly following this can be risky. Always confirm with other indicators.
Breakout Trading Strategy
Breakouts happen when price moves strongly outside the bands.
How to trade breakouts:
-
Watch for tight bands (low volatility)
-
Wait for sudden expansion
-
Enter trade in breakout direction
Breakouts often signal strong market moves.
Reversal Trading Strategy
Reversal trading focuses on price bouncing back from bands.
Key idea:
-
Price touching upper band may reverse downward
-
Price touching lower band may reverse upward
But always confirm with volume or trend analysis.
The Bollinger Squeeze Strategy
The Bollinger squeeze happens when bands become very tight.
This means:
-
Low volatility
-
Market is preparing for a big move
Traders wait for breakout direction and enter trade accordingly.
This is one of the most powerful setups in trading.
Common Mistakes Traders Make
Many beginners misuse Bollinger Bands. Here are mistakes to avoid:
-
Trading without confirmation
-
Ignoring market trend
-
Using it alone
-
Overtrading signals
Remember, indicators are helpers, not decision-makers.
Limitations of Bollinger Bands
Even though useful, Bollinger Bands have limitations:
-
They don’t predict direction
-
False signals in sideways markets
-
Require confirmation tools
-
Not suitable alone for trading decisions
Real Market Example
Let’s say a stock is trading at ₹100.
-
Upper Band = ₹110
-
Lower Band = ₹90
If price goes to ₹90 and starts rising, it may signal a buying opportunity.
If price goes to ₹110 and starts falling, it may signal selling pressure.
This simple structure helps traders make decisions quickly.
Tips for Beginners
If you are new to trading:
-
Combine Bollinger Bands with RSI
-
Use proper risk management
-
Avoid emotional trading
-
Practice on demo accounts first
Also, learning from a best trading trainer in india can help you understand real market applications faster and more effectively.
Final Thoughts
The Bollinger Band formula is one of the most practical tools in technical analysis. It helps traders understand volatility, trends, and potential reversals in the market.
But remember, success in trading doesn’t come from one indicator. It comes from practice, patience, and proper learning.
If used correctly, Bollinger Bands can become a powerful part of your trading toolkit.
Conclusion
Bollinger Bands are simple yet powerful. They help traders see the market in a structured way. Whether you are a beginner or an experienced trader, understanding the bollinger bands indicator and bollinger bands trading strategy can improve your decision-making.
Always remember—markets are unpredictable, but tools like Bollinger Bands help you stay prepared.
FAQs
1. What is Bollinger Band in simple words?
It is a tool that shows whether prices are high, low, or normal using a moving average and two bands.
2. What is the Bollinger band formula?
Upper Band = SMA + 2×SD, Lower Band = SMA − 2×SD, Middle Band = SMA.
3. Is Bollinger Bands a good trading strategy?
Yes, but it works best when combined with other indicators like RSI or MACD.
4. Can beginners use Bollinger Bands?
Yes, it is one of the easiest indicators for beginners to understand and apply.
5. Who is the best trading trainer in India?
There are many experienced trainers, but choosing one depends on your learning style and trading goals.